


Watch
Also on our YouTube channel.
At a Glance
Who this is for: CFOs, FP&A directors, and operators who evaluate capital-intensive platforms—whether launch vehicles or AI inference stacks—and want receipts, not adjectives.
Thesis: SpaceX outperformance is legible in cadence (87% U.S. share), reuse-driven $/kg (~$2,720/kg base), and integrated Launch + Starlink comps (~94.8× EV/Revenue at IPO offer on S-1 FY2025 revenue)—not mystery multiples alone [1][7][27].
Workbook: Download the FMVA-style model and trace Step 4 cell-by-cell; every SpaceX P&L row is labeled composite case.
Executive Summary
Who this is for: CFOs, FP&A directors, and operators who evaluate capital-intensive platforms—whether launch vehicles or AI inference stacks—and want receipts, not adjectives.
SpaceX listed on Nasdaq as SPCX in June 2026, filing an S-1 with audited FY2025 financials. You can now triangulate launch cadence, implied $/kg economics, and relative valuation multiples against peers who also file—using public primary data for SpaceX where the comp table requires it.
This workbook triangulates those three layers. At the base-case assumptions in the committed model—15 booster reuses, 15600 kg payload, $15M amortized first-stage cost—implied marginal cost lands near $2,720/kg to LEO, versus $25,000/kg on Rocket Lab's public Electron benchmark and $18,500/kg on a GAO-era legacy EELV-class reference [11][12]. On cadence, FAA-licensed U.S. launch data shows SpaceX rising from 62% of domestic orbital activity in 2018 to 87% in 2024 [1][16]. On relative value, SpaceX at ~94.8× EV/Revenue (IPO offer on S-1 FY2025 revenue) sits above Rocket Lab (11.9×) and Iridium (3.6×) in our peer snapshot [2][5][27].
The story those numbers tell is not "cheap rockets." It is reuse amortization + operating leverage + vertical integration: each additional flight spreads fixed costs; each booster reuse drives down amortized hardware; Starlink captures downstream margin that pure launch vendors cannot. That is FMVA-style logic applied with public inputs and explicit composite bounds—not a price target.
Illustrative operator-education model. SpaceX financials are composite estimates. Not investment advice. Verify primary sources.
The Question
What explains SpaceX's economic outperformance versus aerospace peers—and what is auditable versus assumed?
Public markets give us audited filings for Rocket Lab, Boeing's Defense/Space segment, Lockheed Martin Space, Iridium, and Viasat [2]–[6]. Regulators give us launch manifests and spectrum deployment milestones [1][9]. SpaceX gives us vehicle specs and reuse milestones—not P&L [7].
So the honest framing is triangulation:
Unit economics — Can we bound $/flight and $/kg from public physics and pricing?
Cadence — Does launch share data show compounding operating leverage?
Relative comps — How does the market price integrated launch + constellation vs pure-play alternatives?
The workbook answers all three with formulas you can trace cell-by-cell. Where SpaceX lacks filings, we label rows composite case and run low/base/high scenarios [14][15].
Public Inputs
Every external row in the workbook carries license_terms and data_as_of. Summary:
Dataset: U.S. licensed orbital launches (2018–2024) · Source: FAA AST · license_terms: Public domain — U.S. gov · data_as_of: 2025-06-01 · Ref: [1]
Dataset: Rocket Lab 10-K (revenue, launches) · Source: SEC EDGAR · license_terms: Public disclosure · data_as_of: 2025-05-15 · Ref: [2]
Dataset: Boeing / Lockheed segment revenue · Source: SEC EDGAR · license_terms: Public disclosure · data_as_of: 2025-05-15 · Ref: [3][4]
Dataset: Iridium / Viasat constellation metrics · Source: SEC EDGAR · license_terms: Public disclosure · data_as_of: 2025-05-15 · Ref: [5][6]
Dataset: Falcon 9 payload and reuse specs · Source: SpaceX IR · license_terms: Company IR — public · data_as_of: 2024-12-01 · Ref: [7]
Dataset: NASA CRS award benchmarks · Source: NASA · license_terms: Public domain · data_as_of: 2024-12-01 · Ref: [8]
Dataset: Starlink FCC deployment milestones · Source: FCC IBFS · license_terms: Public disclosure · data_as_of: 2024-12-01 · Ref: [9]
Dataset: Legacy launch cost study · Source: GAO · license_terms: Public domain · data_as_of: 2023-06-01 · Ref: [11]
Dataset: Electron list pricing · Source: Rocket Lab · license_terms: Vendor published · data_as_of: 2024-12-01 · Ref: [12]
Dataset: Private valuation / revenue estimates · Source: Press composite · license_terms: Secondary — verify · data_as_of: 2025-06-01 · Ref: [14][15]
Prohibited in this pack: paywalled equity research, non-public cap tables, unaudited "leaked" financials. If a row is not in the allowlist, it does not ship.
How we bound SpaceX revenue (composite)
The Revenue_bridge sheet uses $18.67B FY2025 total revenue from the S-1, with an estimated 40% launch / 60% Starlink split where the prospectus does not separate segments [27]:
Segment: Launch services · Base ($B): 7.5 · Share: 40% · Source type: composite case
Segment: Starlink · Base ($B): 11.2 · Share: 60% · Source type: composite case
Segment: Total · Base ($B): 18.67 · Share: 100% · Source type: public_primary
Launch revenue scales with manifest cadence (Figure 1) and published mission pricing bands [8]. Starlink revenue scales with subscriber scenarios in Assumptions (3.5M–5.5M subs × $100–$120 ARPU) cross-checked against FCC deployment milestones [9]. Treat the bridge as directional mix math, not audited segment reporting.
Peer financial extracts (public primary)
Rocket Lab reported $260M revenue on 16 Electron launches in its fiscal 2024 narrative—pure-play launch economics you can read directly from the 10-K [2]. Iridium's $720M revenue reflects mature constellation service with ~8% service take-rate dynamics visible in segment footnotes [5]. Boeing and Lockheed rows use Defense/Space segment revenue—not commercial launch purity—so we use them as scale anchors, not line-for-line launch comps [3][4]. The comp table flags this in the segment_note column of the workbook.
Model Architecture
The workbook follows FMVA build order—inputs before narrative:
Inputs (FAA, 10-K extracts, pricing pages)
 ↓
Assumptions (yellow cells — reuse, payload, cost drivers)
 ↓
Calculations (cost build-up, $/kg, peer multiples)
 ↓
Outputs (summary table, revenue bridge, comp football field)
 ↓
Sensitivity (reuse × cadence; Starlink subs × ARPU)
 ↓
Provenance + Research_sources (audit trail)
Download: verification pack on theaioperator.net. Sheet names match the CSV exports in data/.
Build Walkthrough
Five steps reproduce the headline $2,720/kg base case. Open the Assumptions sheet:
Step 1 — Set reusable payload mass. Cell payload_kg (base 15600 kg) reflects Falcon 9 LEO capacity with booster recovery [7]. Lower bound 14000 kg models degraded recovery; upper 22800 kg is expendable max—use sensitivity, not base case.
Step 2 — Amortize the booster. booster_amort_per_flight = booster_cost / reuse_count. With booster_cost = $15M and reuse_count = 15 [7][11]: $1.0M per flight in hardware amortization alone.
Step 3 — Add marginal costs. On Calculations, marginal_cost_per_flight (C4) = propellant + refurbishment + booster amort + platform ops. Base case: $0.30M + $2.5M + $1.0M + $38.6M platform ops (Assumptions!D5) → ~$42.4M per flight.
Step 4 — Convert to $/kg. Calculations!C5 = C4 × 1,000,000 / Assumptions!D6. $42.4M / 15600 kg ≈ $2,720/kg—the lead worked number in this article.
Step 5 — Compare to peers. Figure 2 pulls the same calculation alongside Rocket Lab's $25,000/kg small-sat benchmark ( $7.5M flight / 300 kg from public Electron pricing) [12] and GAO legacy $18,500/kg reference [11]. The gap is order-of-magnitude, not rounding error.
Worked example (one row): On Calculations, C4 sums Assumptions!D3:D5 plus booster amort C2 → $42.4M. C5 divides by 15600 kg → ~$2,720/kg. Change only Assumptions!D7 (reuse_count) from 15 to 5 and C5 jumps without other edits. Confirm Checks sheet reads OK at base case.
Findings
Act I — Cadence compounds capacity
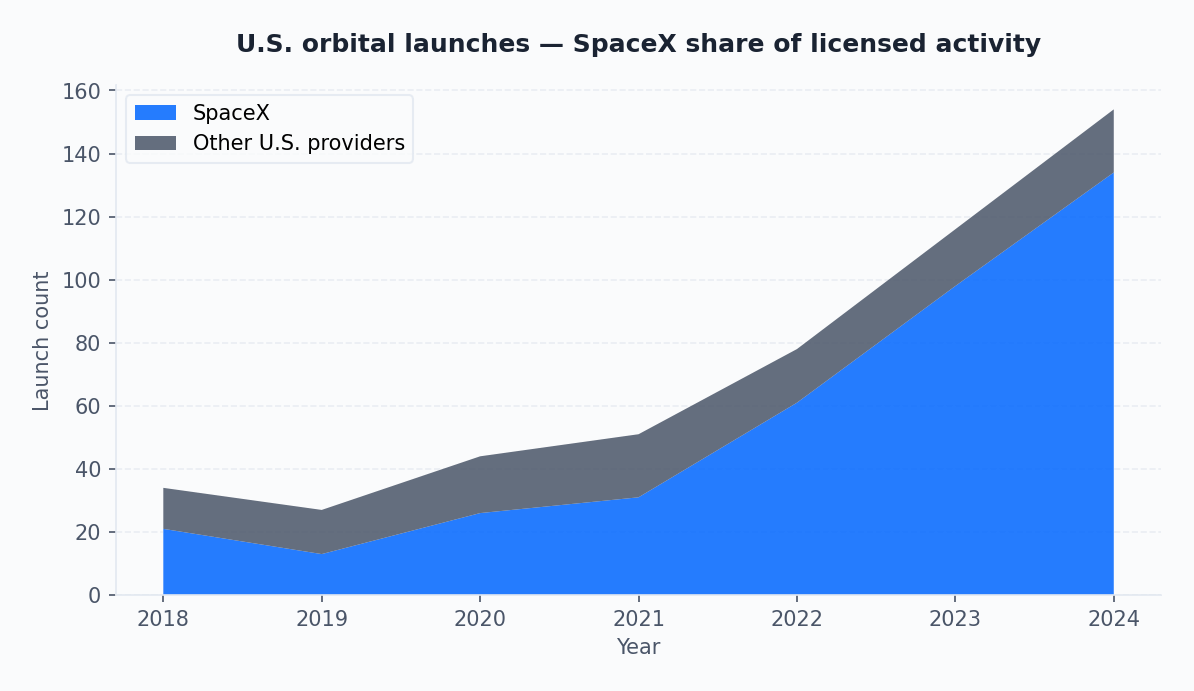
Figure 1. U.S. orbital launches — SpaceX share of FAA-licensed activity, 2018–2024 [1][16].
SpaceX went from 21 of 34 U.S. launches (2018) to 134 of 154 (2024)—87% share. Fixed pad, recovery, and ops teams spread over more flights. That is classic operating leverage: the denominator (annual launches) enters the overhead allocation in Step 3. Competitors with single-digit cadence cannot match the same cost curve without reuse and volume [16][17].
Act II — Reuse rewires unit economics
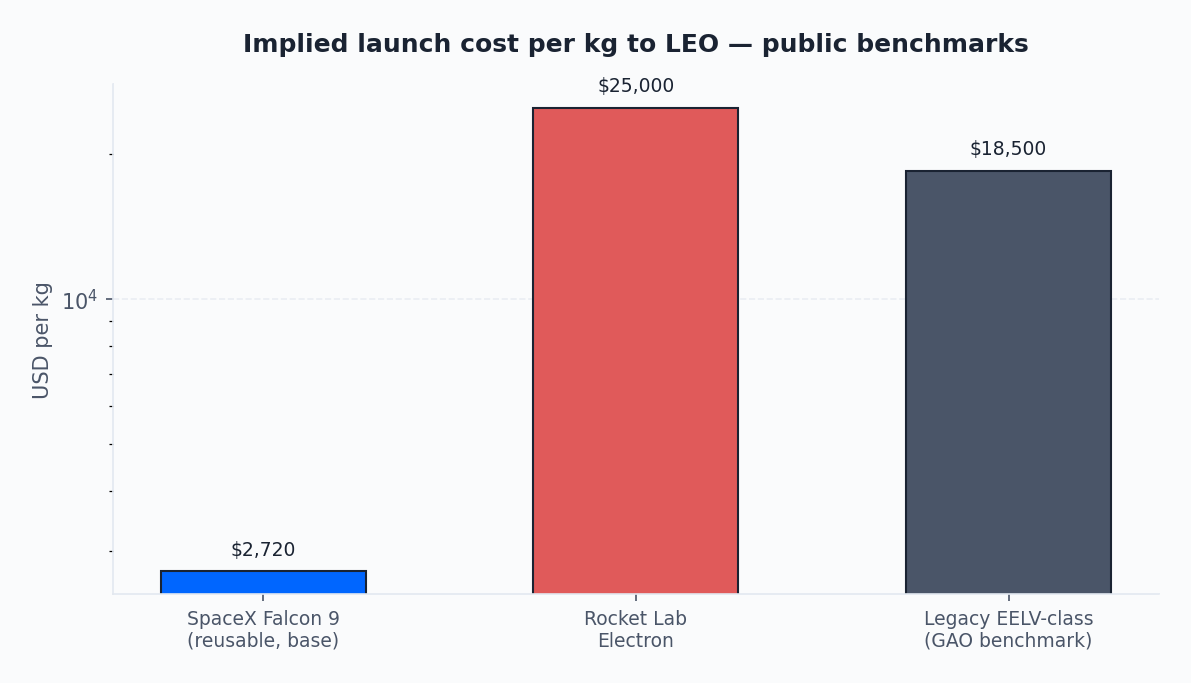
Figure 2. Implied launch cost per kg to LEO — public benchmarks (log scale) [7][8][11][12][13].
At base reuse (15 flights per booster), $/kg falls sharply versus single-use hardware. Figure 4 heatmaps the sensitivity: at 20 reuses and 130 launches/year, modeled $/kg approaches $1,360—half the base case. The model breaks if reuse stalls (left column) or cadence drops—those are operational risks, not spreadsheet tricks.
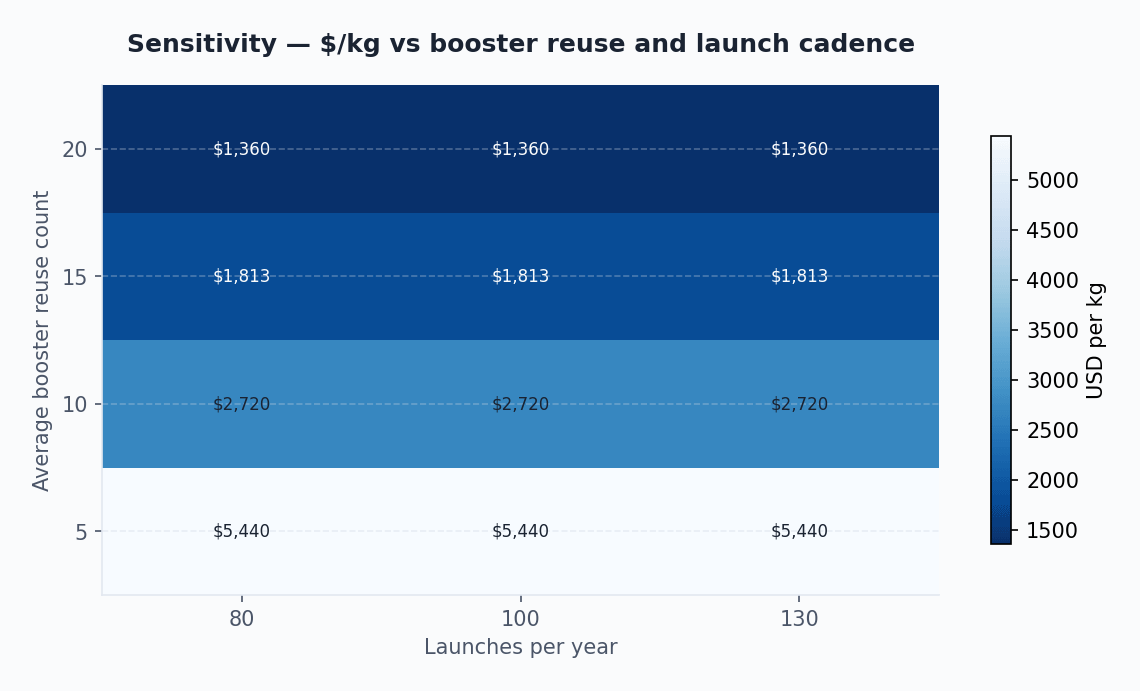
Figure 4. Sensitivity — $/kg vs average booster reuse and annual launch cadence [7][11][17].
Act III — Vertical integration shows up in comps
SpaceX does not separately disclose Launch and Starlink in the S-1 comp table. The Revenue_bridge sheet models an estimated split: 40% launch ($7.5B) / 60% Starlink ($11.2B) on $18.67B S-1 FY2025 revenue [27]. Iridium and Viasat show what public markets pay for constellation services alone—3.6× and 0.7× EV/Revenue respectively in our snapshot [5][6].
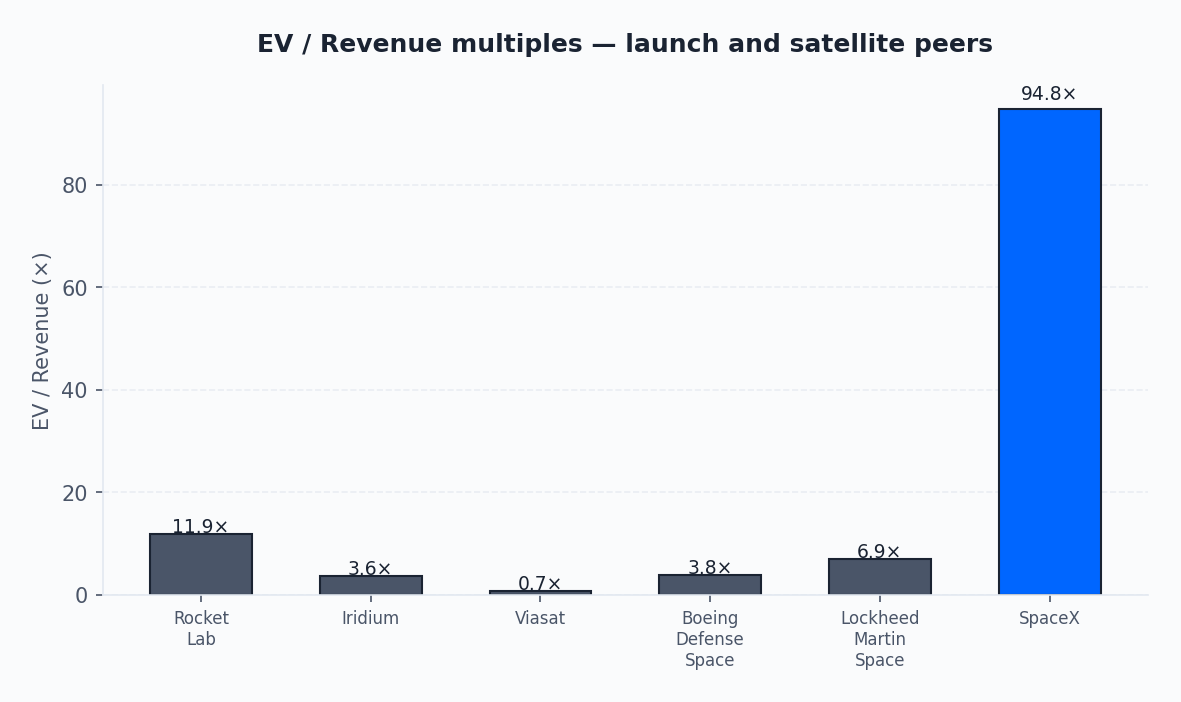
Figure 3. EV / Revenue multiples — launch and satellite peers (May 2025 snapshot) [2]–[6][14].
Rocket Lab trades at 11.9× on $260M revenue—pure-play launch premium [2]. SpaceX at ~94.8× on S-1 FY2025 revenue embeds Starlink scale the market prices separately for smaller peers [27]. Boeing (3.8×) and Lockheed (6.9×) segments mix defense programs unrelated to commercial launch—comps are directional, not perfect [3][4].
Sensitivity & Limits
What breaks the thesis:
Reuse regression — A booster fleet grounded for investigation collapses amortization assumptions; $/kg reverts toward expendable economics.
Cadence plateau — Overhead allocation rises if launches/year stall below 100 while fixed costs do not [1].
Starlink ARPU compression — Revenue bridge shifts; integrated premium in comps may compress toward pure-play launch multiples [15].
Private valuation staleness — Press marks ($175B–$350B range in Assumptions) lag operations; use comp-implied range, not a single headline [14].
Scenario table (from Sensitivity sheet)
Scenario: Bear · reuse_count: 5 · launches/yr: 80 · $/kg: 5,440 · Narrative: Reuse regression + cadence stall
Scenario: Base · reuse_count: 15 · launches/yr: 130 · $/kg: 2,720 · Narrative: Current workbook default
Scenario: Bull · reuse_count: 20 · launches/yr: 150 · $/kg: 1,360 · Narrative: Mature reuse fleet at peak cadence
Starlink sensitivity (subs × ARPU) shifts revenue mix from 34% launch-heavy to >75% services-heavy at bull subscriber counts—comps then resemble Iridium/Viasat more than Rocket Lab [5][6]. Starship, defense, and international expansion are out of base scope; note them in appendix commentary only.
Disclaimer (required): This article and workbook are for operator education. SpaceX S-1 FY2025 underpins Fig3; Launch/Starlink segment splits are estimated where not disclosed. Models simplify propellant, insurance, R&D, and Starship optionality. Not investment advice. Verify SEC, FAA, and FCC primary sources before decisions.
Operator Implications
SpaceX is an extreme case of patterns operators recognize elsewhere:
Reuse = amortization logic. A booster reused 15 times behaves like capital equipment spread across units produced—identical to spreading GPU capex across inference batches or embedding index rebuilds [18]. If you cannot count reuses, you cannot truthfully compute marginal cost.
Cadence = capacity planning. Launch share is the aerospace analog of workflow throughput in AI ops: fixed platform costs divided by decisions/month. FinOps chargeback articles in our archive make the same point on the P&L—central pools hide moral hazard when volume surges [18].
Vertical integration = make-vs-buy on margin. Starlink internalizes launch margin that Iridium historically purchased externally [5]. In AI, the parallel is owning retrieval, eval, and serving versus stitching vendors—integration premium shows up in comp tables when markets believe downstream capture.
Relative comps beat false precision. FMVA teaches triangulation when DCF inputs are fragile. For newly public operators, peer multiples plus unit economics often outperform a single discounted cash flow built on guessed margins [17].
Translation table — aerospace → AI ops
SpaceX mechanic: Booster reuse amortization · Workbook cell:
booster_cost / reuse_count· AI operator parallel: GPU generation amortized over inference batches before upgradeSpaceX mechanic: Launch cadence · Workbook cell:
launches_per_year· AI operator parallel: Workflow throughput (decisions/month) spreading fixed platform costSpaceX mechanic: Vertical integration (Starlink) · Workbook cell: Revenue_bridge mix · AI operator parallel: Owning retrieval + eval + serve vs buying best-of-breed
SpaceX mechanic: Peer EV/Revenue · Workbook cell: Fig3_comps · AI operator parallel: SPCX 94.8× at IPO offer vs Rocket Lab 11.9× — platform premium in board comps
SpaceX mechanic: Sensitivity heatmap · Workbook cell: Fig4_sensitivity · AI operator parallel: Reuse count × traffic — marginal $/decision surface
When your CFO asks "why is inference spend up 22% while governed workflows grew 9%," the answer should look like Step 4—not a narrative without cells [18]. Chargeback articles in our archive exist precisely because central pools hide the same operating-leverage math Figure 1 shows for launch share [18].
If you publish internal workbooks, steal three conventions from this pack: (1) public primary vs composite labels on every row, (2) low/base/high on assumptions, (3) a Verification data section with a download link auditors can open. That is FMVA hygiene applied outside finance classrooms.
Verification data
Asset: Excel workbook (formulas + Checks) · Download: verification pack on theaioperator.net
Asset: Branded workbook PDF · Download: PDF on theaioperator.net
Architecture diagrams are embedded as Figures 1–4 in this essay; video and audio companions are in the learning package above.
Formulas and peer extracts live in the model workbook, `assumptions.csv`, and `manifest.json`.
cd content/articles/spacex_relative_valuation_workbook_article
pip install -r../requirements-finance.txt
python3 export_verification_pack.py
python3 render_slides_pdf.py
python3 render_workbook_pdf.py
npm run verify:finance-workbooks -- --slug=spacex-relative-valuation-workbook
After npm run sync:article-assets, all files serve under /api/article-assets/spacex-relative-valuation-workbook/data/.
Key Takeaways
SpaceX success is legible in cadence (87% U.S. share in 2024), reuse-driven $/kg, and integrated Launch + Starlink economics—not mystery multiples alone [1][7].
Base-case modeled $2,720/kg traces to public assumptions; sensitivity shows $1,360–$5,440/kg bounds when reuse and cadence move [11][17].
Peer comps place SpaceX (SPCX) at ~94.8× EV/Revenue at IPO offer vs Rocket Lab 11.9× and Iridium 3.6×—markets pay for integration when downstream revenue is credible [2][5][27].
Every SpaceX P&L row is composite; FAA and SEC peer data are public primary—keep the distinction visible in your own models.
Operators in any capital-intensive stack should copy the discipline: unit economics + relative comps + explicit disclaimer, not a single heroic DCF.
References
[1] FAA Office of Commercial Space Transportation. Yearly licensed launch activity (U.S.). 2025. https://www.faa.gov/data_research/commercial_space_data
[2] Rocket Lab USA Inc. Form 10-K annual report. 2024. https://www.sec.gov/cgi-bin/browse-edgar?action=getcompany&CIK=0001819994&type=10-K
[3] The Boeing Company. Form 10-K annual report. 2024. https://www.sec.gov/cgi-bin/browse-edgar?action=getcompany&CIK=0000012927&type=10-K
[4] Lockheed Martin Corporation. Form 10-K annual report. 2024. https://www.sec.gov/cgi-bin/browse-edgar?action=getcompany&CIK=0000936468&type=10-K
[5] Iridium Communications Inc. Form 10-K annual report. 2024. https://www.sec.gov/cgi-bin/browse-edgar?action=getcompany&CIK=0001418819&type=10-K
[6] Viasat Inc. Form 10-K annual report. 2024. https://www.sec.gov/cgi-bin/browse-edgar?action=getcompany&CIK=0000797728&type=10-K
[7] SpaceX. Falcon 9 overview and reusability. 2024. https://www.spacex.com/vehicles/falcon-9/
[8] NASA. Commercial Resupply Services overview. 2024. https://www.nasa.gov/commercial-resupply/
[9] FCC. SpaceX Starlink authorization and deployment milestones. 2024. https://licensing.fcc.gov/myibfs/
[10] Commercial Spaceflight Federation. State of the launch industry report. 2024. https://www.commercialspaceflight.org/
[11] U.S. Government Accountability Office. Evolved Expendable Launch Vehicle: DOD assessment. 2023. https://www.gao.gov/
[12] Rocket Lab. Electron launch services and specifications. 2024. https://rocketlabusa.com/electron/
[13] United Launch Alliance. Atlas V launch services overview. 2023. https://www.ulalaunch.com/
[14] Reuters. SpaceX valuation and funding round coverage. 2024. https://www.reuters.com/technology/spacex/
[15] SpaceNews. Launch market share and cadence analysis. 2024. https://spacenews.com/
[16] BryceTech. Commercial launch activity statistical summary. 2024. https://brycetech.com/
[17] McKinsey & Company. Space sector economics and vertical integration. 2023. https://www.mckinsey.com/industries/aerospace-and-defense/our-insights
[18] The AI Operator. Chargeback and unit economics on the P&L (archive). 2025. https://theaioperator.com/articles/
[19] KuCoin / industry commentary. Elon Musk projects $1 trillion SpaceX revenue by 2030. 2025. https://www.kucoin.com/
[20] Mostly metrics. SpaceX IPO S-1 breakdown: financials, Starlink, CEO comp. 2025. https://mostlymetrics.com/
[21] Payload Space. SpaceX reveals financial data ahead of IPO. 2025. https://payloadspace.com/
[22] Callan. Mega-IPOs in 2026: how indices are adapting. 2025. https://www.callan.com/
[23] SpotGamma. SpaceX IPO index inclusion impact on SPY, QQQ, IWM. 2025. https://spotgamma.com/
[24] Industry commentary. SpaceX IPO looks wobbly; early unlocked selling and passive squeeze. 2025.
[25] MergerSight. SpaceX $250bn acquisition of xAI. 2025. https://www.mergersight.com/
[26] Delaware corporate law review. The high price of control: Elon Musk and Delaware judiciary. 2025. (Supplementary governance context.)
Learn Next
Open the slide deck and map each act to workbook sheets (Assumptions → Calculations → Outputs).
Download the workbook and reproduce Step 4 ($/kg) with your own
reuse_count.Refresh peer EV/Revenue from current market data before presenting comps to finance [2]–[6].
Monday Morning Checklist
[ ] Download the workbook and trace Step 4 ($/kg) cell-by-cell with your own Assumptions overrides.
[ ] Pull latest FAA launch totals; update Figure 1 if 2025 year-to-date diverges from model [1].
[ ] Refresh peer EV/Revenue from current market data before presenting comps to finance [2]–[6].
[ ] Label every non-SEC row in your internal copy composite case before sharing outside editorial.
[ ] Run low/base/high on
reuse_countandlaunches_per_year; document which scenario matches your ops narrative.[ ] Add one paragraph to your capital memo: reuse amortization analog in your domain (GPUs, embeddings, workflow throughput) [18].
[ ] Confirm disclaimer block remains in slide appendix—not investment advice, verify primary sources.
Editorial transparency. Essays at The AI Operator may use AI-assisted research, drafting, and editing tools under staff editorial review. Facts, figures, and recommendations are checked before publication; we correct the record when evidence changes. Questions: hello@theaioperator.net.
Published on [Substack](https://theaioperator.net/p/spacex-relative-valuation-workbook).