
The Rebuild Threshold: When Quick AI Fixes Cost More Than Starting Over
When quick fixes compound past the rebuild threshold, the expensive decision is patching one more sprint—not the rebuild you deferred.


Executive Summary
Quick fixes start cheap and accelerate; full rebuilds start expensive and flatten. The intersection of those two curves—the rebuild threshold—is where the economics flip, and missing it is what turns a manageable maintenance decision into a 2–5x cost overrun. This playbook follows a composite cast—an Engineering Director, a CTO, and a Finance lead—through eight months of "one more patch" that cost $640,000 before they finally rebuilt for $250,000. Recognized early, that threshold would have saved them $390,000 and eight months of declining morale. Use it when a patch that used to take two weeks is starting to take six.
Opening scene / stakes
Lena Park, Engineering Director, has watched the same pattern for three straight sprints: a patch that should take a week takes three, and the fix touches code nobody fully understands anymore. Marcus Chen, the CTO, isn't convinced—each individual patch still looks cheap on the invoice, and a rebuild quote of $200,000–$250,000 is not a number he wants to defend at the board meeting. Jordan Hale, running Finance, is the one who actually has the ledger: patch costs that were $15,000 a month a year ago are now $45,000 and climbing, and nobody assigned an owner to notice when that trend became the real cost of the system.
The system in question is a customer-facing recommendation engine that shipped fast, got patched constantly, and never got the rebuild anyone kept deferring. Lena's team keeps saying yes to "just one more fix." Marcus keeps approving it because the alternative—three months of a visible rebuild—feels riskier than a debt nobody can see accumulating. Jordan is the only one tracking the actual number.
By month eight, Jordan's spreadsheet says $640,000 spent on patches. Marcus finally approves the rebuild: $250,000, delivered in three months. Total cost of the year: $890,000. If Lena's team had rebuilt when patch cost first crossed roughly 30% of the rebuild estimate—months earlier—the same outcome would have cost $500,000. The $390,000 difference is not a rounding error. It's what "one more patch" actually cost.
Composite operators / illustrative scene — not one customer's books.
Why this keeps happening
Every AI operator faces the same question repeatedly: patch this system, or rebuild it? Sculley's hidden technical debt frame explains why patches compound faster than teams model [1]. The economics look simple in the moment Lena faces them—a two-week, $25,000 patch versus a three-month, $200,000 rebuild—so the patch wins the sprint planning meeting almost every time. What the sprint meeting doesn't show is that the patch makes the next patch harder, and the one after that harder still. That's the mechanism that turned Lena's $25,000 patches into $75,000 patches within twelve months, and turned a deferred decision into an $890,000 year.
This framework is for the moment before that math becomes obvious: engineers and operators making maintenance calls, engineering leaders allocating resources between upkeep and new work, and executives who need a number more defensible than "it feels like time to rebuild." It does not apply to systems still in early, low-complexity stages, one-off fixes that don't compound, or prototypes with no production future—those are patch calls, full stop.
The Framework: Understanding the Cost Curves
The core insight is the same one Jordan's spreadsheet eventually made undeniable: quick fixes and full rebuilds have fundamentally different cost structures that create a threshold where the economics flip.
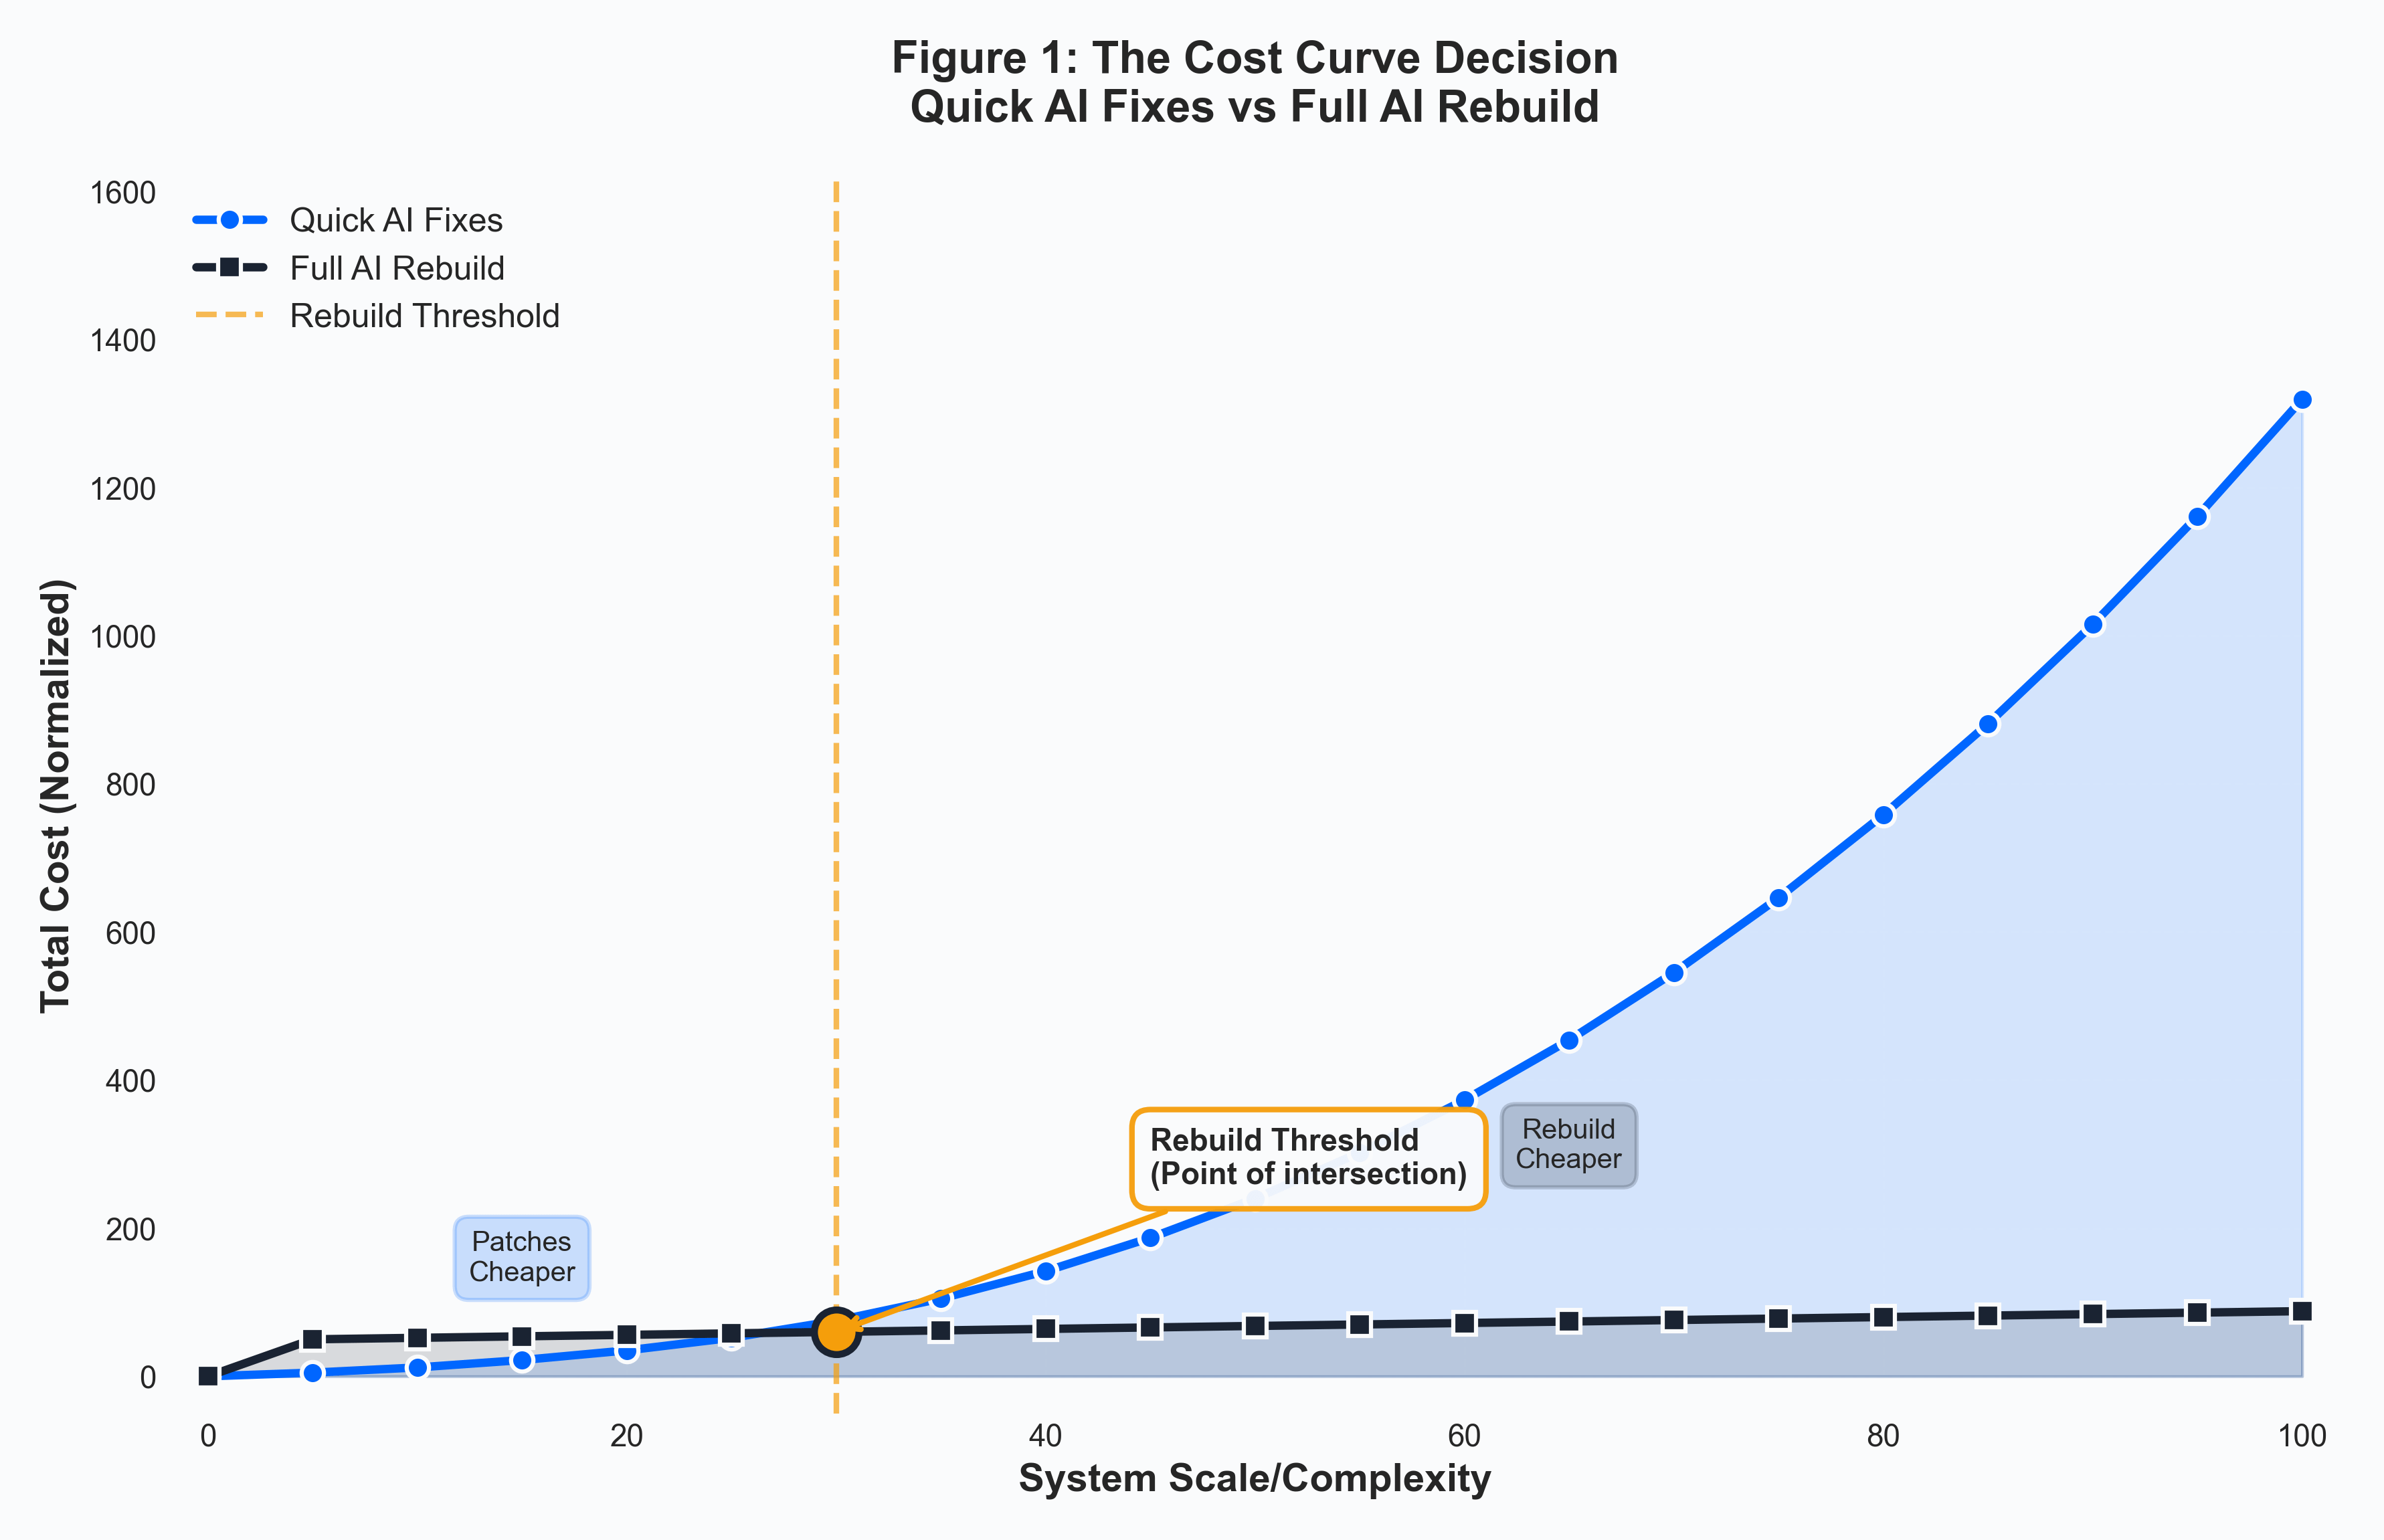
Figure 1: The Cost Curve Decision
Two curves illustrate the economic dynamics: Quick AI Fixes (blue) start cheap but accelerate rapidly as system complexity increases. Full AI Rebuild (navy) starts expensive but flattens, creating a sustainable base. The intersection point—the Rebuild Threshold—marks where rebuilds become cheaper than continued patching. Before the threshold, patches are economically optimal. After the threshold, rebuilds are economically optimal. Operator skill is recognizing where you are on this curve before you've passed the efficient frontier.
The Quick Fix Curve (Accelerating Costs)
Quick fixes start inexpensive. That first patch? Maybe a few hours of work. The second? A bit more. But as systems scale and patches accumulate, costs accelerate for several reasons:
Compounding Complexity:
Each patch adds complexity that makes the next patch harder
Workarounds interact in unexpected ways, creating debugging time
Testing becomes more difficult as edge cases multiply
Technical Debt Accumulation:
Patches often bypass proper architecture, creating maintenance burden [1]
Documentation lags, increasing onboarding and maintenance time [2]
Code quality degrades, making changes riskier and slower [4]
Scale Effects:
More users mean patches need more testing and rollback planning
Larger data volumes make changes more expensive to validate
More dependencies mean patches have broader impact
The result: quick fixes follow an accelerating curve—each patch costs more than the last, and the rate of increase itself increases. This is the curve Lena's $15K-to-$45K-a-month trend traced almost exactly.
The Rebuild Curve (Flattening Costs)
Rebuilds start expensive. The initial investment is substantial: architecture design, full rewrite, comprehensive testing, migration planning. But once the new system is built, costs flatten:
Clean Foundation:
Modern architecture designed for current needs [2]
No accumulated technical debt or workarounds
Proper documentation and patterns from the start [3]
Sustainable Base:
Maintenance costs are predictable and lower
New features integrate cleanly without workarounds
System performance and reliability are optimized
Economies of Scale:
Initial investment amortizes over system lifetime
Clean architecture scales more efficiently
Maintenance burden doesn't compound as quickly
The result: rebuilds follow a flattening curve—high initial cost, then sustainable maintenance. This is the curve Marcus's $250,000 rebuild quote traced once Lena's team actually shipped it.
The Rebuild Threshold
The intersection point of these curves—the rebuild threshold—is where the economics flip. Before the threshold, patches are cheaper. After the threshold, rebuilds are cheaper.
Recognizing the Threshold:
Patches are taking 2-3x longer than they used to
Each new feature requires working around multiple previous patches
System performance is degrading despite patches
Team velocity is declining due to technical debt
Cost per patch is approaching 30-40% of a rebuild's initial cost
The Critical Insight:Operator skill is recognizing where you are on this curve—and whether that next "cheap" AI fix is actually pushing you past the efficient frontier. The most expensive decision isn't rebuilding too early—it's patching too long and paying the accelerating costs. Lena's team didn't lack the data; Jordan had the ledger the whole time. What they lacked was a threshold defined before the pressure of a sprint deadline was in the room.
Step-by-Step Process: Applying the Framework
This is the process Lena's team eventually ran—three months too late, by their own admission, but it's the process that got Marcus a number he could defend to the board and gave Jordan a ledger with an owner.
Step 1: Assess Current System Position
Objective: Determine where your system currently sits on the cost curve.
Process:
Calculate Recent Patch Costs
Identify the last 5-10 patches/fixes
Calculate total engineering time for each (including testing, debugging, rollback planning)
Track cost trends: Are they increasing, and at what rate?
Estimate Rebuild Cost
Architecture and design: 20-30% of total
Development: 40-50% of total
Testing and QA: 15-20% of total
Migration and deployment: 10-15% of total
Use recent rebuild projects as benchmarks if available
Measure System Complexity Indicators
Lines of code or model complexity metrics
Number of dependencies and integrations
User base size or request volume
Data volume or processing requirements
Team size required for maintenance
Checklist:
[ ] Compiled data on last 5-10 patch costs with time breakdown
[ ] Calculated average patch cost and trend (increasing/decreasing/flat)
[ ] Estimated total rebuild cost (architecture + development + testing + migration)
[ ] Measured current system complexity metrics
[ ] Compared patch cost trend to rebuild cost estimate
Key Considerations:
Include all costs: engineering time, testing, deployment, rollback planning, documentation
Use actual time tracking data, not estimates
Consider opportunity cost: time spent patching vs building new features
Factor in maintenance burden: patches that make future work harder
Expected Outcome: You'll have quantitative data showing where your system sits on the curve—whether patches are still cheap or approaching the threshold.
Step 2: Analyze Cost Trajectory
Objective: Project where costs are heading if you continue patching versus rebuilding.
Process:
Extrapolate Patch Costs
Use recent trend to project next 6-12 months of patch costs
Factor in expected system growth (users, data, complexity)
Account for compounding effects: patches making future patches harder
Project Rebuild Timeline
Estimate time to rebuild (typically 3-6 months for medium systems)
Calculate cost over rebuild period
Estimate post-rebuild maintenance costs (typically 20-30% of rebuild cost annually)
Compare Total Cost of Ownership
Scenario A: Continue patching for 24 months
Scenario B: Rebuild now, then maintain for 24 months
Include opportunity costs (features not built due to maintenance)
Checklist:
[ ] Projected patch costs for next 12 months based on current trends
[ ] Estimated rebuild timeline and total cost
[ ] Calculated post-rebuild maintenance costs
[ ] Compared 24-month TCO for patch vs rebuild scenarios
[ ] Factored in opportunity costs and system growth
Key Considerations:
Be realistic about growth projections
Account for non-linear cost increases (compounding complexity)
Consider that rebuilds often take longer than estimated
Factor in learning curve for new system (temporary productivity dip)
Expected Outcome: You'll have quantitative projections showing which path is cheaper over the next 24 months.
Step 3: Evaluate Strategic Factors
Objective: Consider non-economic factors that influence the patch/rebuild decision.
Process:
Assess Business Context
Product lifecycle stage (early growth vs mature vs declining)
Competitive pressure and time-to-market requirements
Strategic importance of the system
Available engineering resources
Evaluate Technical Factors
Can the current system scale to meet future needs?
Is the technology stack becoming obsolete?
Are there new architectural patterns that would help?
What's the risk of continuing to patch (stability, security)?
Consider Team Factors
Team morale and technical satisfaction
Learning and growth opportunities
Recruitment and retention implications
Team capacity and availability
Checklist:
[ ] Assessed product lifecycle stage and strategic importance
[ ] Evaluated system's ability to scale to future needs
[ ] Considered technology stack obsolescence risk
[ ] Assessed team morale and technical satisfaction
[ ] Evaluated resource availability and capacity
Key Considerations:
Sometimes rebuilds make sense even if patches are slightly cheaper (strategic value)
Sometimes patches make sense even near threshold (resource constraints, timing)
Team factors matter: demoralized teams are less productive
Consider risk: patches might work, but rebuilds provide more certainty
Expected Outcome: You'll have qualitative context to inform the decision beyond pure economics.
Step 4: Make the Decision
Objective: Synthesize economic and strategic factors into a clear decision.
Process:
Compare Economic Analysis
If patch costs are accelerating and approaching rebuild costs → Rebuild
If patches are still cheap and threshold is far away → Patch
If you're at or past the threshold → Rebuild
Apply Strategic Overrides
If system is strategically critical and showing risk → Rebuild
If resources are constrained and patches are still viable → Patch (but plan rebuild)
If technology stack is obsolete → Rebuild
Set Decision Criteria
Define clear metrics for revisiting the decision
Set timeline for reassessment (typically every 3-6 months)
Establish thresholds that trigger rebuild (e.g., "if patch cost exceeds X% of rebuild")
Checklist:
[ ] Compared economic analysis (cost curves) to strategic factors
[ ] Made clear decision: Patch or Rebuild
[ ] Documented decision rationale and criteria
[ ] Set timeline for reassessment
[ ] Established triggers for revisiting decision
Key Considerations:
The decision doesn't have to be binary: you might patch short-term while planning rebuild
Document the decision so you can learn from it later
Set clear success metrics for whatever path you choose
Revisit the decision regularly—systems and contexts change
Expected Outcome: You'll have a clear decision with documented rationale and criteria for reassessment.
Step 5: Execute and Monitor
Objective: Implement the decision and track outcomes to validate the framework.
Process:
If Patching:
Implement patches efficiently (don't cut corners that create more debt)
Track actual costs vs projections
Monitor system metrics (performance, reliability, maintainability)
Reassess at defined intervals
If Rebuilding:
Plan rebuild carefully (architecture, migration, rollout)
Track rebuild costs vs estimates
Monitor post-rebuild metrics (performance, reliability, maintenance burden)
Compare actual outcomes to projections
Learn and Iterate:
Document what worked and what didn't
Refine cost estimates and projections
Update framework based on learnings
Share insights with team
Checklist:
[ ] Implemented chosen path (patch or rebuild)
[ ] Tracking actual costs vs projections
[ ] Monitoring system metrics and performance
[ ] Reassessing at defined intervals
[ ] Documenting learnings for future decisions
Key Considerations:
Both paths require discipline: patches shouldn't create more debt, rebuilds shouldn't over-engineer
Track metrics that matter: cost, performance, reliability, team velocity
Learn from the decision regardless of outcome
Use learnings to improve future decisions
Expected Outcome: You'll have executed the decision, validated the framework, and learned for future applications.
Decision Framework
Use this decision tree to guide your patch vs rebuild decision:
Decision Points
Are patch costs accelerating?
If No (patches are stable or decreasing): Continue patching, reassess in 6 months
If Yes (patches are getting more expensive): Proceed to Question 2
Are you at or past the rebuild threshold?
Calculate: Average patch cost / Rebuild cost estimate
If < 30%: Continue patching, but monitor closely
If 30-50%: You're approaching threshold, plan rebuild timeline
If > 50%: You're past threshold, rebuild is economically optimal → Proceed to Question 3
Do you have resources and capacity for rebuild?
If No: Consider hybrid approach (critical patches only, plan rebuild for next quarter)
If Yes: Proceed to Question 4
Is the system strategically critical or showing risk?
If Yes: Rebuild (strategic override)
If No: Proceed to Question 5
Can you afford to delay features for rebuild period?
If Yes: Rebuild now (economic and strategic benefits)
If No: Hybrid approach (patch critical issues, plan rebuild timeline)
Decision Matrix
Patch Cost / Rebuild Cost: < 30% · System Growth: Low · Strategic Importance: Low · Decision: Patch
Patch Cost / Rebuild Cost: < 30% · System Growth: Low · Strategic Importance: High · Decision: Patch, plan rebuild
Patch Cost / Rebuild Cost: < 30% · System Growth: High · Strategic Importance: Any · Decision: Patch, monitor closely
Patch Cost / Rebuild Cost: 30-50% · System Growth: Any · Strategic Importance: Any · Decision: Plan rebuild timeline
Patch Cost / Rebuild Cost: > 50% · System Growth: Any · Strategic Importance: Any · Decision: Rebuild
Patch Cost / Rebuild Cost: Any · System Growth: Any · Strategic Importance: High + Risk · Decision: Rebuild (override)
Common Pitfalls
Pitfall 1: Optimizing for Short-Term Cost
The Problem: Choosing patches because they're cheaper this quarter, ignoring long-term trajectory.
How to Avoid:
Always compare 24-month total cost of ownership, not just immediate cost
Project cost trends, not just current costs
Factor in opportunity costs (features not built due to maintenance)
Example: A team chose to patch a system for 18 months at $50K/month instead of rebuilding at $200K upfront. Total patch cost: $900K. Rebuild cost: $200K + $60K/year maintenance = $320K over 24 months. They paid 2.8x more by optimizing for short-term.
Pitfall 2: Underestimating Rebuild Costs
The Problem: Rebuilds often cost 2-3x initial estimates due to migration complexity, scope creep, and unexpected challenges.
How to Avoid:
Use conservative estimates (multiply initial estimate by 1.5-2x)
Benchmark against similar rebuild projects
Include all costs: architecture, development, testing, migration, training
Build in buffer for unexpected challenges (20-30% contingency)
Example: A team estimated $150K rebuild, but migration complexity added $100K, and scope creep added $50K. Actual cost: $300K (2x estimate). They should have used $225K-$300K in their analysis.
Pitfall 3: Ignoring Compounding Effects
The Problem: Assuming patch costs will remain stable, ignoring that each patch makes the next one harder.
How to Avoid:
Model accelerating costs, not linear growth
Factor in technical debt accumulation
Account for decreasing team velocity due to complexity
Use historical data: if patches increased 20% last year, assume similar or higher this year
Example: A team assumed patches would cost $30K/month indefinitely. But as complexity compounded, costs accelerated: $30K → $45K → $70K → $110K. After 12 months, they'd spent $765K vs projected $360K.
Pitfall 4: Missing the Threshold
The Problem: Continuing to patch past the rebuild threshold because "one more patch will work."
How to Avoid:
Set clear thresholds upfront (e.g., "if patch cost exceeds 40% of rebuild, we rebuild")
Reassess regularly (every 3-6 months), not just when things break
Track metrics that indicate threshold proximity (team velocity, patch complexity, system performance)
Don't let "one more patch" become "ten more patches"
Example: This is Lena, Marcus, and Jordan's story, in the vocabulary of the framework. Their team kept patching past the threshold because each patch seemed "almost done." They spent 8 months and $640K on patches before finally rebuilding for $250K. Total cost: $890K. If they'd rebuilt at the threshold: $250K plus the patches already sunk. Cost of missing the threshold, by their own ledger: roughly $390K. Illustrative composite—not one company's audited books.
Pitfall 5: Rebuilding Too Early
The Problem: Rebuilding when patches are still cheap, wasting resources on premature optimization.
How to Avoid:
Only rebuild if you're at or past the threshold (patch cost > 30-40% of rebuild)
Consider strategic overrides carefully (don't use them to justify premature rebuilds)
If patches are cheap and system is stable, continue patching
Use the decision framework—don't skip the economic analysis
Example: A team rebuilt a system when patches cost $20K and rebuild cost $300K (7% ratio). They spent $300K to save $240K/year in patches. Payback period: 15 months. But if they'd waited 12 months to reach threshold (patch cost $120K, 40% ratio), they'd have saved $120K in patches and rebuilt for $300K. Net: $180K savings by waiting.
Real-World Examples
The following three examples are illustrative composites drawn from patterns across operator interviews—not measured client books.
Example 1: E-Commerce Recommendation System
Situation:A mid-size e-commerce company had a recommendation system built 5 years ago. The system worked but required frequent patches as the business grew. Patch costs were accelerating: $15K/month → $28K/month → $52K/month over 18 months.
Application:The team applied the framework:
Step 1: Calculated average patch cost: $32K/month (trending up)
Step 2: Estimated rebuild cost: $280K (4 months, 3 engineers)
Step 3: Ratio: $32K / $280K = 11% (below threshold, but accelerating)
Step 4: Projected 12-month patch costs: $600K+ (accelerating trend)
Step 5: Decision: Plan rebuild for next quarter (threshold approaching)
Results:
Rebuilt system in 4 months for $285K (within estimate)
Post-rebuild maintenance: $18K/month (44% reduction)
24-month savings: $300K+ ($600K patches - $285K rebuild - $15K maintenance)
System performance improved 35%, team velocity increased 40%
Key Learnings:
Recognizing threshold early (before passing it) saved significant cost
Rebuild improved not just cost but performance and team productivity
Planning rebuild timeline (rather than immediate rebuild) balanced economics with business continuity
Example 2: Customer Support Chatbot
Situation:A SaaS company's customer support chatbot had accumulated 40+ patches over 3 years. Each new feature required working around previous patches. Patch costs: $45K/month and accelerating. Team morale was declining due to technical debt.
Application:The team applied the framework:
Step 1: Average patch cost: $45K/month, rebuild estimate: $180K
Step 2: Ratio: $45K / $180K = 25% (approaching threshold)
Step 3: 12-month patch projection: $650K (accelerating)
Step 4: Strategic factors: System critical, team morale low, performance degrading
Step 5: Decision: Rebuild (past threshold + strategic override)
Results:
Rebuilt in 3 months for $195K (8% over estimate)
Post-rebuild maintenance: $22K/month (51% reduction)
24-month savings: $450K+
Team morale improved significantly, velocity increased 55%
System reliability improved (99.2% → 99.8% uptime)
Key Learnings:
Strategic factors (team morale, system criticality) justified rebuild even at threshold
Rebuild improved multiple dimensions: cost, performance, reliability, team satisfaction
Fast rebuild (3 months) minimized business disruption
Example 3: Data Processing Pipeline
Situation:A data analytics company's processing pipeline had been patched 25 times over 2 years. Patch costs were stable at $18K/month. System was working well, but team wanted to modernize architecture.
Application:The team applied the framework:
Step 1: Average patch cost: $18K/month, rebuild estimate: $320K
Step 2: Ratio: $18K / $320K = 5.6% (well below threshold)
Step 3: 12-month patch projection: $216K (stable)
Step 4: Strategic factors: System stable, no performance issues, modernization desired but not critical
Step 5: Decision: Continue patching (economics don't justify rebuild)
Results:
Continued patching for 12 months: $216K
Rebuild cost avoided: $320K (premature optimization)
System continued performing well
Team focused on high-value features instead of unnecessary rebuild
Key Learnings:
Framework prevented unnecessary rebuild (economics didn't justify it)
"Modernization" isn't sufficient reason to rebuild—economics matter
Continuing to patch when appropriate maximizes resource efficiency
Tools and Resources
Cost Tracking Tools
Time Tracking: Toggl, Harvest, or internal time tracking systems
Project Management: Jira, Linear, or similar for tracking patch complexity and time
Cost Analysis: Spreadsheets or financial tools for TCO calculations
Decision Framework Templates
Cost curve analysis spreadsheet template
Decision matrix template
TCO comparison template
Benchmarking Resources
Industry benchmarks for rebuild costs (typically 3-6 months for medium systems)
Patch cost trends from similar systems
Maintenance cost ratios (post-rebuild maintenance typically 20-30% of rebuild cost annually)
Technical Assessment Tools
Code complexity metrics (cyclomatic complexity, technical debt ratio)
System performance monitoring (latency, reliability, error rates)
Team velocity tracking (story points, features delivered)
Key Takeaways
Cost curves create a threshold: Quick fixes start cheap but accelerate; rebuilds start expensive but flatten. The intersection point—the rebuild threshold—is where economics flip.
Recognize your position: Operator skill is recognizing where you are on the curve before you've passed the efficient frontier. Track patch costs, compare to rebuild estimates, and project trajectories.
Compare total cost of ownership: Don't optimize for short-term cost. Compare 24-month TCO for patching versus rebuilding, including opportunity costs and system growth.
Set clear thresholds: Define metrics that trigger rebuild (e.g., patch cost exceeds 30-40% of rebuild estimate). Reassess regularly, not just when things break.
Consider strategic factors: Economics aren't everything. Factor in system criticality, team morale, technology obsolescence, and resource availability.
The most expensive decision is patching too long: Missing the rebuild threshold costs 2-5x more than rebuilding at the right time—as Lena, Marcus, and Jordan's $390,000 gap shows.
Reflection
Nobody on Lena's team made a single bad call. Each individual patch was, on its own, the cheaper option that sprint. That's exactly what made the pattern invisible until Jordan's ledger forced the conversation Marcus didn't want to have. The framework didn't tell them anything they couldn't have calculated themselves—it just gave the number an owner and a deadline before the board meeting made it urgent.
One question to carry: Do you know your current patch-cost-to-rebuild ratio right now—today's actual number—or are you still working from the feeling that the next fix will be the last one?
References
Sculley, D., et al. (2015). Hidden Technical Debt in Machine Learning Systems. NeurIPS. https://papers.nips.cc/
Huyen, C. (2022). Designing Machine Learning Systems. O'Reilly Media. https://www.oreilly.com/library/view/designing-machine-learning-systems/9781098107956/
National Institute of Standards and Technology. (2023). Artificial Intelligence Risk Management Framework (AI RMF 1.0). https://www.nist.gov/itl/ai-risk-management-framework
IEEE. (2024). Software engineering body of knowledge — maintenance and evolution (directional). https://www.computer.org/
Editorial transparency. Essays at The AI Operator may use AI-assisted research, drafting, and editing tools under staff editorial review. Facts, figures, and recommendations are checked before publication; we correct the record when evidence changes. Questions: hello@theaioperator.net.
Published on [Substack](https://theaioperator2.substack.com/p/rebuild-threshold).