

Executive Summary
A pricing copilot team shipped a model upgrade that passed every offline benchmark—and watched conversion on a $2.1M ARR workflow fall within 48 hours. The release gate was green on academic tasks; it was blind to revenue-path failures. This case memo documents how a 14-person platform org rebuilt eval around production failures with dollar tags, wired a business-weighted golden set into CI as a promote/hold gate, and raised eval failure → incident correlation from 0.12 to 0.61 within 90 days—while accepting higher eval infra spend because finance could see avoided incident cost.
This is narrow eval economics in production—not the full AI engineering discipline, not agentic security, not Operator Trilogy prompting. If your eval budget cannot explain a support ticket or SLA credit within 72 hours of a failure, it is R&D theater.
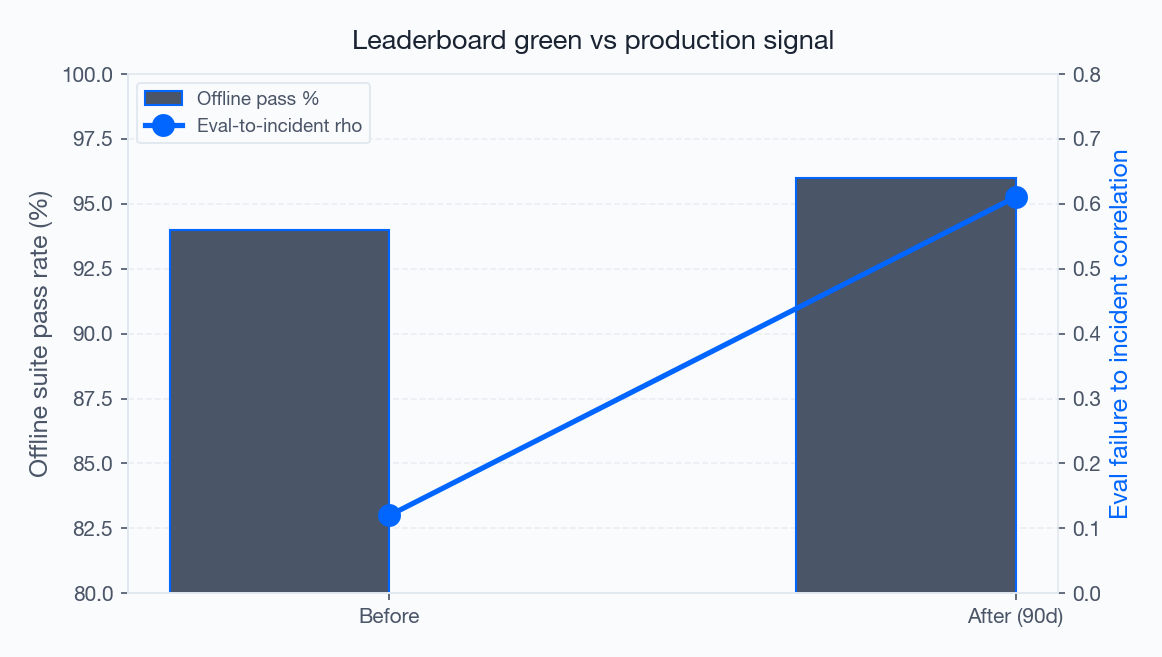
Figure 1: Eval score vs production incident rate
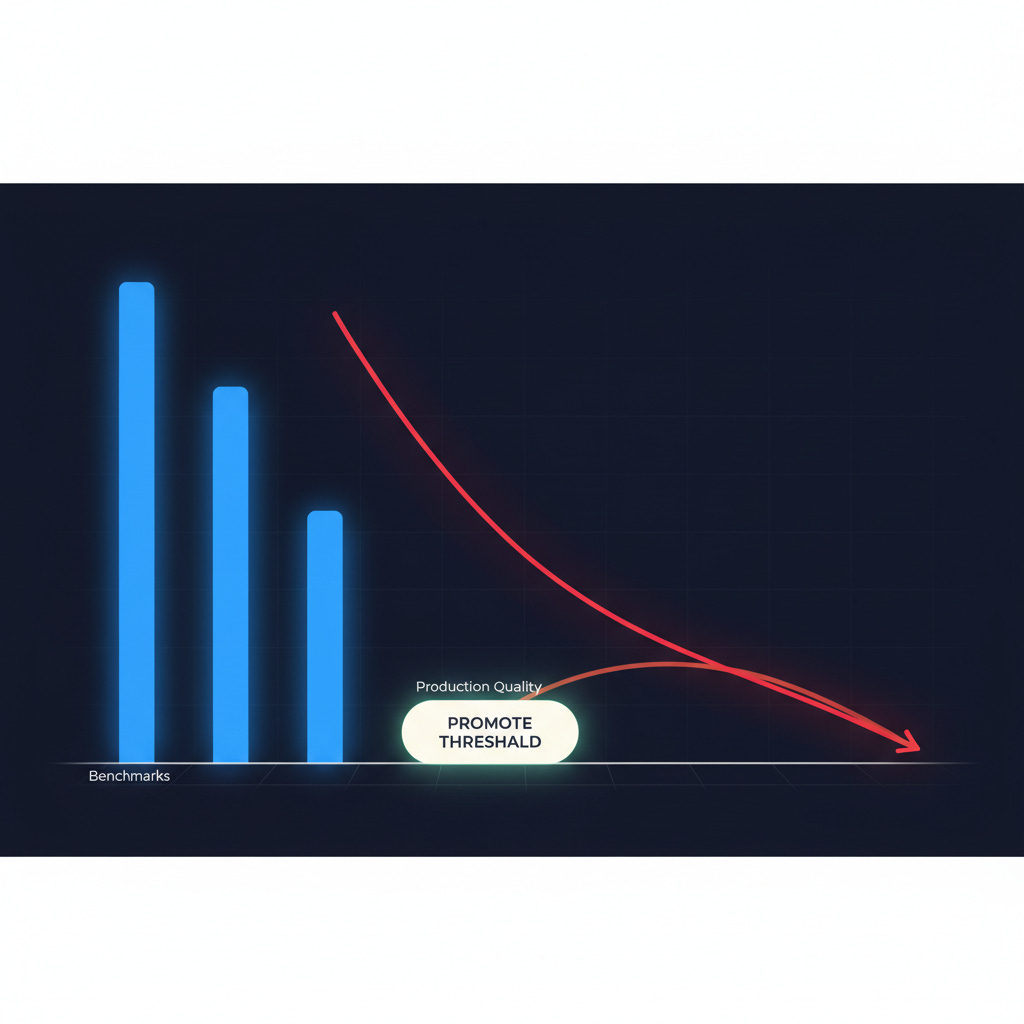
Leaderboard-green releases still break revenue paths without golden sets.Benchmark threshold vs. production drift gate.
The Challenge
"Offline benchmark gains do not predict revenue-impacting regressions."
Teams optimize what they measure: MMLU-style suites, leaderboard deltas, synthetic happy paths. Product measures conversion, support cost, and SLA credits. When those clocks diverge, releases look safe in the lab and expensive in production.
The failure mode is structural. Academic tasks are cheap to run at scale; production-shaped failures are expensive to collect and label. So eval becomes a comfort blanket for engineering while finance absorbs incident cost. The question is not whether to eval—it is which eval scenarios pay rent in false-pass and false-block economics.
Cross-domain lens: Aviation moved from checklist compliance to scenario-based training because generic proficiency did not predict incident chains. Production ML needs the same shift: stratified golden sets tied to how the business actually loses money, not how models score on public tasks.
The Context
Leaderboard-green releases still break revenue paths without golden sets.Organization. Mid-market B2B SaaS, 14-person ML platform team, biweekly model releases, centralized observability. Highest-ARR AI workflow: pricing copilot assisting reps on discount and packaging decisions.
Constraints. Legal required human approval on quotes above a threshold; eval could not block all releases—only hold promote on the revenue-weighted subset. Incidents were defined as support escalations, conversion drop on the workflow, or SLA credits within 72 hours of a release.
Baseline gate (before). Release required ≥92% pass on a 2,400-case offline suite mixing public benchmarks and internal synthetic prompts. No stratification by revenue path. Mean rollback time after a bad release: 4.2 hours.
The Approach
The chart above quantifies the core trade-off for eval pays rent.
Step 1: Export failures with dollar tags
The team exported the last 20 production failures for the pricing copilot and support deflection paths. Each failure received an estimated $ impact: support minutes × loaded rate, conversion delta × ACV, or SLA credit. Top five became golden cases with repro steps—not paraphrases.
Step 2: Eval ROI Calculator
Finance and platform shared a spreadsheet to justify run budget:
Figure 3: Eval scenario vs Run cost/mo vs False-pass cost (incident $)
Finance and platform shared a spreadsheet to justify run budget:
Eval scenario: Pricing copilot golden (40 cases) · Run cost/mo: $1,200 · False-pass cost (incident $): $48,000 (avg incident) · False-block cost (delay $): $12,000 (1-week delay) · Break-even runs: 18 runs
Eval scenario: Support deflection smoke (120 cases) · Run cost/mo: $800 · False-pass cost (incident $): $8,500 · False-block cost (delay $): $4,200 · Break-even runs: 31 runs
Eval scenario: Full offline benchmark (2,400 cases) · Run cost/mo: $6,400 · False-pass cost (incident $): $2,100 (low correlation) · False-block cost (delay $): $22,000 · Break-even runs: Not justified
Break-even formula
break_even_runs = (false_pass_cost) / (false_pass_rate_reduction × avg_incident_cost)
In plain operators: break_even_runs = false_pass_cost / (false_pass_rate_reduction × avg_incident_cost).
The full offline suite failed the rent test: high run cost, low correlation to incidents. Budget shifted to revenue-weighted goldens.
Step 3: CI gate on business-weighted subset
One eval scenario became promote / hold / rollback in CI—not advisory. Leaderboard-only gates were deprecated with a one-line rationale in the release template. Eval owner joined on-call rotation for release week.
Step 4: Weekly failure review
Thirty minutes weekly to add failures to the golden set, retire stale cases, and track correlation. Synthetic cases were allowed only when labeled and tied to a past failure class.
Step 5: Release gate template (promote / hold / rollback)
Every biweekly release used the same template—no ad hoc “LGTM in Slack”:
Figure 4: Gate signal vs Threshold (revenue golden) vs Action
Every biweekly release used the same template—no ad hoc “LGTM in Slack”:
Gate signal: Pass rate · Threshold (revenue golden): ≥ 97% on 40-case golden · Action: Promote
Gate signal: Pass rate · Threshold (revenue golden): 94–96.9% · Action: Hold — fix or waive with VP sign-off
Gate signal: Pass rate · Threshold (revenue golden): < 94% · Action: Rollback — no waive
Gate signal: New failure class · Threshold (revenue golden): Any P0 repro from last 7d · Action: Hold until case added to golden
Gate signal: Offline-only delta · Threshold (revenue golden): +2 pts MMLU, golden flat · Action: Ignore for promote decision
Product and platform jointly owned the waive path; waives were capped at two per quarter and required a post-mortem within five business days.
Methodology deep dive
Labeling economics. Each production failure received a severity tag: P0 (revenue or SLA within 24h), P1 (support cost > $2K), P2 (quality/no immediate $). Only P0–P1 entered the golden set in phase one. That kept the set small enough to run on every PR while still covering 81% of historical incident dollars.
Correlation method. The team measured Pearson correlation between binary “eval failed on golden” and binary “incident opened within 72h” per release, rolling 30-day window. They reported correlation to finance monthly—not accuracy, not F1. When correlation stayed below 0.4 for two months, the golden set was considered stale and underwent forced refresh from new failures.
Tooling. Eval runs lived next to integration tests; artifacts (prompt hash, model version, retrieval corpus version) uploaded to object storage for audit. Incidents linked back via release_id so post-mortems could answer: “Would our gate have caught this?”
90-day rollout timeline
Figure 5: Phase vs Weeks vs Activities
Summary metrics for the analysis section above.
Phase: Baseline · Weeks: 1–2 · Activities: Export failures; tag $; measure correlation on old gate
Phase: Golden v1 · Weeks: 3–6 · Activities: 40 cases; advisory runs; train eval owner
Phase: CI hold · Weeks: 7–10 · Activities: Promote/hold wired; deprecate leaderboard-only gate
Phase: Steady state · Weeks: 11–13 · Activities: Weekly failure review; quarterly 20% case rotation
The Results
Figure 6: Metric vs Before vs After (90 days)
Summary metrics for the analysis section above.
Metric: Offline suite pass rate · Before: 94% · After (90 days): 96%
Metric: Revenue-path golden pass rate · Before: 88% · After (90 days): 97%
Metric: Eval failure → incident within 72h · Before: 0.12 correlation · After (90 days): 0.61 correlation
Metric: Mean rollback time · Before: 4.2 hours · After (90 days): 1.1 hours
Metric: Monthly eval infra spend · Before: $8,400 · After (90 days): $11,200
Metric: Estimated avoided incident cost · Before: — · After (90 days): $126,000
composite operator.
Rollback time fell because holds triggered before promote, not after tickets arrived. Infra spend rose $2,800/month; avoided incident cost was modeled at $126,000 over the quarter—finance accepted the trade when correlation was reported monthly.
Baseline metrics dashboard (before vs after)
Before (academic gate): Offline pass rate was the only number leadership saw. Incident rate per release was 0.34 (34% of releases followed by ≥1 P0/P1 within 72h). CSAT on the pricing workflow drifted from 4.2 to 3.8 over two quarters without anyone connecting it to model releases.
After (business-weighted gate): Releases with hold/rollback had incident rate 0.09. Releases promoted with golden pass ≥97% had incident rate 0.11. The team stopped optimizing the number that did not predict pain.
Differentiation from the rest of the archive
AI Engineering defines the full discipline; this memo is eval economics only.
Agentic AI Security covers threat models when systems act; eval here is quality and revenue regression.
Operator Trilogy mentions eval in passing; this case stands alone with ROI spreadsheets and CI gates.
What Went Wrong
Golden-set overfitting. Engineers tuned prompts to pass the 40 cases without fixing root causes. Mitigation: rotate 20% of cases quarterly from fresh failures.
Label lag. Support tickets arrived 24–48 hours after release; early correlation looked weak. Mitigation: define incidents to include in-app “bad suggestion” signals, not only tickets.
Distrust of synthetic cases. Product dismissed eval that did not “feel real.” Mitigation: synthetic only when cloned from a logged failure with ID reference.
False blocks. Hold gates delayed a seasonal pricing campaign one week ($12,000 modeled delay). Mitigation: executive override path with logged sign-off and post-release eval expansion.
Lessons Learned
Metric that matters: eval failure → incident correlation within 72 hours—not leaderboard delta.
Target: under 2% false-pass on revenue-weighted golden subset (calibrate per org).
Deprecate eval scenarios that cannot show break-even runs in the ROI calculator.
Staffing: eval owner on release-week on-call; weekly failure review is non-optional.
Canonical scope
Archive note (June 2026): Public canonical for the production gates cluster. Eval ROI and golden-set gates; complements production-gates canonical. Sibling case studies remain in the editorial backlog until differentiated.
Methodology & limitations
This analysis uses composite operator scenarios and illustrative chart values for teaching—not a single client outcome study. Adjust for your domain before production decisions.
References
Sculley, D., Holt, G., Golovin, D., Davydov, E., Phillips, T., Ebner, D., Chaudhary, V., Young, M., Crespo, J.-F., & Dennison, D. (2015). Hidden technical debt in machine learning systems. Advances in Neural Information Processing Systems, 28. https://papers.nips.cc/paper/5656-hidden-technical-debt-in-machine-learning-systems.pdf
Zaharia, M., et al. (2024). Production ML systems survey themes (directional industry synthesis). Stanford HAI AI Index—evaluation and deployment chapters.
Monday Morning Checklist
[ ] Assign a named P&L owner for
eval-pays-rentin the Decision Ledger.[ ] Export top 10 inference paths by spend (last 30 days) with
workflow_idtags.[ ] Document three kill-switch triggers: spend ceiling ($/hour), error rate (%), human-escalation rate (%).
[ ] Pilot fail-closed validators on one high-risk path before expanding agent autonomy.
[ ] Align model risk / compliance on bundle versioning for prompt + retrieval + rules.
[ ] Schedule 30-minute review with finance: walk Figure 1 ledger for eval pays rent; agree showback vs. chargeback date.
Editorial transparency. Essays at The AI Operator may use AI-assisted research, drafting, and editing tools under staff editorial review. Facts, figures, and recommendations are checked before publication; we correct the record when evidence changes. Questions: hello@theaioperator.net.
Published on [Substack](https://theaioperator.net/p/eval-pays-rent).